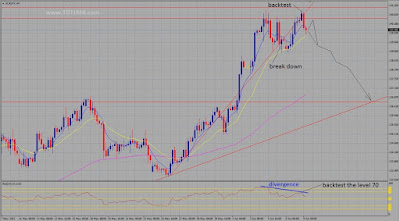
Az EUR-JPY árfolyama H4 időtávon tört egy emelkedő
trendvonalat, majd visszatesztelte azt. Az utóbbi két gyertya esetén
felfedezhetünk egy elnyelő alakzatot. Továbbá divergencia ismerhető fel az
árfolyam és az RSI mozgása között.
Napos bontásban tekintve a grafikont látható, hogy egy
vízszintes trendvonalhoz érkeztünk. Illetve az RSI túlvett ezen a perióduson.
Sajnos a veszteségvágó megbízást nemigen lehet jobb helyre tenni, mint a
legutóbbi csúcs, ez pedig legalább 100 pip innen.
The price movement of the EUR-JPY exchange rate broke down
an upward trendline on H4 time frame, after that the price tested back that. We
can recognize an engulfing candlestick pattern in the end of the backtest. In
addition there is divergence between the movement of the price and the relative
strength index (RSI).
If we check the chart on daily period, visible the price
reach to an earlier horizontal trendline. The RSI is overbought on daily
period. Unfortunately you need to take the stop loss over the previous top, so
it is about 100 pip at least.


Nincsenek megjegyzések:
Megjegyzés küldése