29 július, 2015

GBP-CAD H4 függő short ajánlat – GBP-CAD H4 pending short order


Nem tervezem, hogy pozit nyissak a 20 órai FED hírek előtt, de ez minimum érdekes.
Szóval így csupán egy függő short ajánlat.

I don’t plan to open a new transaction before the evening FED news, but it is interesting at least.
So, in this situation I just place a pending short order.

EUR-CAD short H4


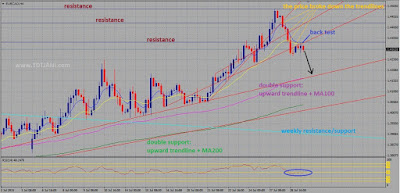
Újabb nekifutás az EUR-CAD shortnak, igaz most kicsit hosszabb idősíkon próbálkozva.
Az árfolyam letört több vízszintes és emelkedő trendvonalat, majd vissza is tesztelte az utolsó kettőt. Az RSI-nek egyelőre nem sikerült visszakapaszkodni az 50-es érték fölé, ez elvileg támogatja a short irányt.
Célár a fordított zászló alakzatból számítható, ez kb. a következő emelkedő trendvonalra esik.


This is my newest short attempt on EUR-CAD currency pair, but now I try it on a longer time frame.
The price broken more horizontal and upward trendlines, and today the price tested back the last two.
The RSI decrease the value of 50 and it can not rise back above it – I think it is support my short idea.
You can calculate the target price from the inverse flag candlestick pattern, it place on the next upward trendline.

24 július, 2015

EUR-CAD short

Több trendfordító gyertyaformáció fedezhető fel az EUR-CAD grafikonján H1 időtávon. Az RSI csökkenő trendben mozog.


There are more reversal candlestick pattern on the chart of EUR-CAD on H1 time frame. The RSI moves in downward trend.

22 július, 2015

GBP-CAD short


A GBP-CAD árfolyamgrafikonján az utolsó 2 óra sírkő doji volt. Az RSI túlvett minden időtávon.


The last two candlestick on the chart of the GBP-CAD were gravestone doji candlestick. The RSI is overbought on every time frame.

EUR-CAD short


 Az EUR-CAD árfolyama az utóbbi két órában kirajzolt egy sírkő dojit majd egy megerősítő eső gyertyát H1 időtávon. Az RSI túlvett illetve egy divergenciát is felfedezhetünk ezen az időtávon.

The price movement of the EUR-CAD exchange rate drew a gravestone doji on H1 time frame, after this the last candlestick was a falling confirmatory candlestick. The RSI is overbought on this time frame, and you can recognize a divergence as well.

04 július, 2015

egy TA kérdés – a TA question


Gyalogtúrázom 2015.07.04-2015.07.12., így addig nem boldogítom a kedves olvasóim. Van azonban egy kérdésem, melyre szívesen venném a technikai elemzésben (TA) jártas olvasóim véleményét, tapasztalatait, válaszait.

Találtam egy grafikont, melyen felismerni vélek egy fej-váll gyertyaformációt. Az érdekesség csupán az, hogy ezt eső trend előzte meg. Én úgy tanultam, a fej-váll alakzat trendfordító, csak ugye jelenleg nincs megelőző emelkedő trend, melyet fordíthatna. Előfordul, hogy a fej-váll gyertyaformáció trenderősítőként jelenik meg/funkcionál?

Ha valakinek van tapasztalata ennek kapcsán,  kérem ossza meg velem/velünk kommentben (link is jó). Előre is köszönöm!


I go to a walk trip in the forest from 2015.07.04. to 2015.07.12. so I will not write any article till that time. But I have got a question, and I would be glad, if somebody – who has got excerience in technical analysis (TA) – could answer to it.

I found a chart, where I can recognize a head and shoulders candlestick pattern. This pattern is strange, because the previous trend was downward. I learnt that, the head and shoulders pattern is a reversal candlestick pattern, but in this case there was not previous upward trend, so it could not turn down anything. Do you know any cases when the head and shoulders candlestick pattern reinforce the trend?

If somebody has got experience in connection with it, please write down that in comment (a link is good as well). Thank in advance.

03 július, 2015

GBP-NZD short

Érzésre. (Remélem azért lesz belőle valami! :) )


I try to trade based on my feeling.

01 július, 2015

USD-CHF short H1


Az USD-CHF árfolyama egy emelkedő ékben mozog felfelé H1 időtávon. Az RSI túlvett. Amennyiben az árfolyam letöri az ék alsó szárát, megpróbálkozhatunk egy short pozíció felvételével. Szigorúan csak szűk követő stoppal!


The exchange rate of the USD-CHF moves in a rising wedge on H1 time frame. The RSI is overbought If the price able to break down the lower leg of the wedge, you can try to open a short transaction. But in this situation, the use of the trailing stop is necessary.