29 január, 2015

USD-JPY short


Az USD-JPY árfolyama 4 órás időtávon elérte az ellenállást. Ha a sávkereskedés szabályait követjük, szűk stoppal tudunk short pozíciót nyitni. Célár a sáv alsó széle.
 

The price of the USD-JPY reached the resistance line on H4 time frame. If we follow the rules of the range-trading, we have a good chance to open a short transaction with a tight stop loss. The target price is the lower edge of the range.

S&P500 short


Fel kell ismernünk, hogy a NASDAQ index árfolyama egy szimmetrikus háromszögben mozog december óta. A legfontosabb kérdés az, hogy a támasz vagy az ellenállás lesz-e az erősebb. (Én azt gondolnám lefelé haladunk majd tovább.)


Az RSI hetes időtávon csökkenő trendben mozog. Hetes időtávon a 100-as mozgóátlag és a legalsó trendvonal együttese támaszként szolgálhat egy ideig.


Havi perióduson az utolsó 3 gyertya egy trendfordító alakzatot formál. Havi időtávon a 21-es mozgóátlag és a legalsó trendvonal együttese támaszként szolgálhat. Az RSI visszapattant a túlvettséget jelentő szintről.


We have to recognize that, the price of the NASDAQ index moves in a symmetrical triangle since December. The most important question is that, which will be the stronger, the resistance or the support.  (I think the downward direction will be the right.)

The RSI moves in a downward trend in weekly period. The MA100 and the lowest upward trendline together can functions as a double support for a time.

The last 3 candles form a reversal candlestick pattern. The MA21 and the lowest upward trendline together can functions as a double support for a time on monthly period. The RSI rebounded from the overbought level.

NASDAQ short


Fel kell ismernünk, hogy a NASDAQ index árfolyama egy szűkülő sávban mozog november óta. A legfontosabb kérdés az, hogy a támasz vagy az ellenállás lesz-e az erősebb. (Én azt gondolnám lefelé haladunk majd tovább.)


Az RSI hetes időtávon csökkenő trendben mozog. Hetes időtávon a 100-as mozgóátlag és a hosszabb trendvonal együttese támaszként szolgálhat egy ideig.
 

We have to recognize that, the price of the NASDAQ index moves in a narrowing range since November. The most important question is that, which will be the stronger, the resistance or the support.  (I think the downward direction will be the right.)

The RSI moves in a downward trend in weekly period. The MA100 and the longer upward trendline together can functions as a double support for a time.

USD-HUF short


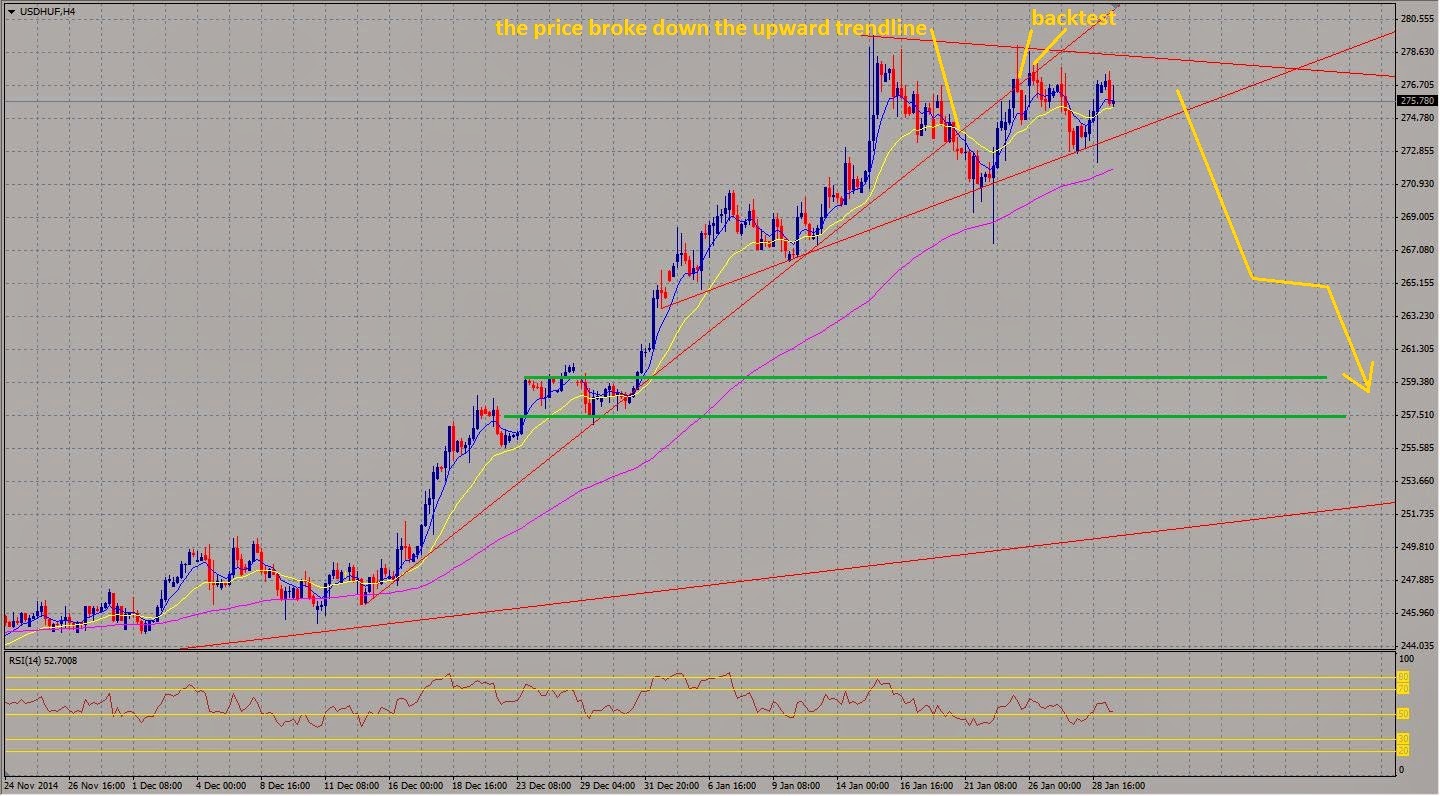
Az USD-HUF grafikonja tört egy december 15 óta tartó emelkedő trendet 4 órás időtávon január 21-én, majd 23-án és 26-án visszatesztelte a letört trendvonalat. Jelenleg egy rövidtávú ellenállás és egy rövid távú támasz között mozog az árfolyam.

Amennyiben az ár töri a támaszt, gyorsan a 260 forintos szintig eshet. Az RSI csökkenő trendben mozog 4 órás és napos időtávon. A 100-as mozgóátlag támaszként szolgálhat órás és négy órás időtávon egyaránt.


The exchange rate of the USD-HUF broke down an upward trendline on H4 time frame, which functions as a support since 15th of December. After it, the price tested back the broken trendline at 23rd and 26th of January. Currently the price is moving between a shorter term resistance and a shorter term support.

If the price able to breaks down the support then could fall down quickly to about the level of 260 HUF. The RSI moves in downward trend on H4 time frame and daily period. The 100' moving average can functions as a support on H1 time frame and H4 time frame as well.

EUR-JPY short


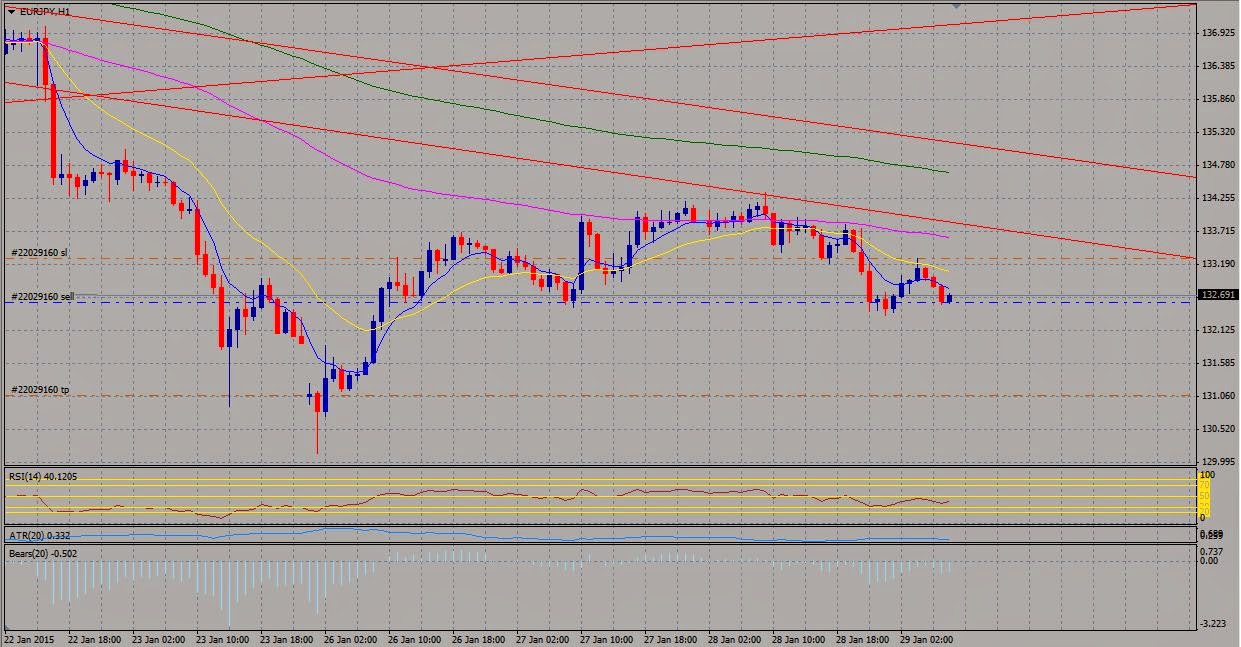
Az EUR-JPY grafikonján egy széles fej és vállak alakzatot fedezhetünk fel 132,58-as nyakvonallal. A célárat körülbelül 131,08-ra tehetjük, stop loss az utolsó csúcs fölé.
Az RSI túlvett állapota okozhat némi bizonytalanságot. Így célszerű lehet a követő stop használata.
 

We can recognize a wide head and shoulders pattern on the chart of the EUR-JPY, the neckline there is at about 132,58. The target price is at about 131,08, take the stop loss above the last top. Unfortunately the RSI is oversold. So the trailing stop could be useful.