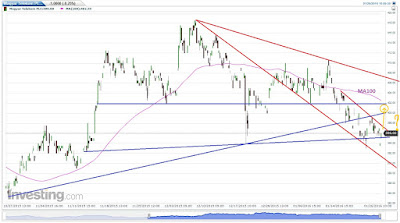
Az EUR-CAD árfolyama január 22-én letörte a december 3-a óta
tartó emelkedő trendvonalat. Ha alaposabban megvizsgáljuk a devizapár
árfolyamgrafikonját H4 időtávon, felismerhetünk egy fordított zászló alakzatot,
melynek a lobogója egy dupla csúcs gyertya formáció.
Napos időtávon az RSI értéke az 50-es érték alá süllyedt,
alacsonyabb idősíkokon azonban már túladottságot mutat az indikátor. Így
valószínűsíthetünk egy felfelé irányuló korrektív mozgást az árfolyam nagy
beszakadása előtt. (Jelenleg, délelőtt 10:10 – a cikk írásakor – az árfolyam
1,5230.) H4 idősíkon szemlélve, jelenleg a 200-as mozgóátlag funkcionál
támaszként, annak letörésével véleményem szerint validálódik is az alakzat.
Fundamentális oldalról két dolog támogatja az árfolyamesést:
1, olaj árfolyammozgás
a) az utóbbi napokban úgy tűnik, hogy az olaj árfolyama kezd
magához térni, sőt a tegnapi gyertyával vissza is kapaszkodott a csökkenő ék
alakzatba, (bár, ez a meglódulás lehet a 28-ai pletyka hatása is, mely szerint
Oroszország és az OPEC tagállamok egyeztetnek a kitermelési kvóta
csökkentéséről),
b) a fekete arany további árfolyam-emelkedése pedig
jelentősen támogathatja a CAD erősödését
2, EKB gazdaságpolitika
a) az EKB december 3-án deklarálta, hogy:
- 2017. márciusáig meghosszabbítja a havi 60 milliárd eurós
kötvényvásárlási programját (mely eredetileg 2016. februárjában kifutott volna)
- valamint mínusz 0,2 százalékról mínusz 0,3 százalékra
módosította a nála elhelyezett egynapos betétekre felszámított büntetőkamatot
b) a testület január 21-ei ülésén:
- Mario Draghi utalt rá, hogy szükségessé váhat az Európai
Központi Bank monetáris politikájának felülvizsgálata, akár már a következő
kamatdöntő ülés során; továbbá jelezte, hogy a szándék is megvan illetve az
eszközök is rendelkezésre állnak a további beavatkozáshoz, amennyiben szükséges
- mint cikkem kezdetén említettem, január 22-én tört az
EUR/CAD emelkedő trendje, ebben valószínűleg szerepe volt az euróval
kapcsolatos spekulációknak is
c) következő kamatdöntő ülés
- amennyiben az EKB esetleg változtatna az irányadó kamaton,
úgy a csökkentéssel ismét a mélybe taszíthatná az euró árfolyamát.
A fordított zászló teteje 1,6014 alja 1,5244 szintnél
található. Az ebből számítható célár: 770 pip.
Mivel én jelenleg még számítok egy felpattanásra, a függő
short megbízásomat 1,5335-re helyeztem el, mely további 90 pippel javítja az
RR-t.
A stoppot véleményem szerint 1,5511 fölé, mondjuk 1,5555-re
célszerű elhelyezni, a célár 1,4474-re adódik, melyet érdemes lehet 1,4490-re
módosítani, mivel ott húzódik egy trendvonal. A hozam kockázat arányra kb. 4:1
jön ki, ami kifejezetten kedvezőnek számít!
____________________________________________________________________________
The price of the EUR-CAD broke down the upward trendline
(which functioned as a support since 3rd of December) at 22nd of January. If
you analyze the chart on H4 time frame, you can recognize, there is an inverse
flag on the chart, and the lower part of it involves a double top candlestick
pattern.
The RSI decreased the value of 50 on daily period, but on
smaller time frame this indicator shows that, the price is oversold. So I think
there would be a little corrective (upward) phase before the big crash. (The
rate is 1,5230 at now – when I am writing this article CET 10:10.) The 200’
moving average is the support on H4 time frame, if the price able to break down
it, the pattern will be valid.
On the funadmental side, there are two reasons which support
the close price collapse:
1, the price movement of the oil
a) it seems to be, the price of the oil become stronger in
the last few days, furthermore it returned into the falling wedge at yesterday,
(although this may be the impact of the 28th January rumor about Russia and the
OPEC counrties consulted in connection with the reduction of the oil mining
quota),
b) if the price of the ’black gold’ able to rising further,
the Canadian doller would be stronger day by day
2, the economy policy of the ECB
a) on the 3rd of December, the ECB declared that:
- they will extend the Quantitative Easing (60 billion euro
per month) till March of 2017. (the original date was February of 2016.)
- the ECB cut the ’one day deposit’ rate from minus 0,2
percent to minus 0,3 percent
b) on the January 21st board meeting:
- Mario Draghi said the review of the monetary policy may be
necessary, perhaps already at the next interest decision meeting (in March); furthermore
he talked about the ECB has the intention and the means as well to the further
intervention if that would be necessary
- as I write at the beginning of my article, the EUR/CAD
broke down the upward trend at 22nd of January – I think this could be the
effect of the euro-speculations
c) the next interest decision meeting
- if the ECB would decrease the benchmark interest rate, it
could push into the deep the euro again
The important levels of the inverse flag are: the top is at
1,6014 the bottom is at 1,5244. So the target price is 770 pips.
Because I think that, there will be a little upward phase, I
placed my pending short order to 1,5335. It improve the RRR with more 90 pips.
My opinion is the the stop loss order need to place above
1,5511 about 1,5555 the target price is 1,4474 but there is a horizontal
trendline at 1,4490 so I placed my take profit order the last mentioned level.
The Risk-Reward Ratio (RRR) is about 1:4, what is very good!


