A következő címkéjű bejegyzések mutatása: breakout. Összes bejegyzés megjelenítése

16 január, 2017

Alcoa – target price 60%


(December közepén már látszott, hogy elbalfaszkodtam az OTP pozi zárását, így akkortól büntiből pihenő pályára küldtem magam. Elvileg most le is telt az 1 hónap, szóval újra elkezdhetek foglalkozni a piacokkal. A kereskedésbe természetesen még nem vetem bele magam egyből, elemezni viszont mindenképpen szükséges.
Ettől az évtől kezdve jóval fegyelmezettebb kereskedést várok el magamtól. [Máskülönben még hosszabb kényszerpihenőt írok elő magamnak.] Ez már csak a hosszú távú célkitűzéseim miatt is nagyon fontos!)


Az Alcoa (NYSE) grafikonját napos bontásban szemügyre véve rögtön szembeötlik, hogy az árfolyam 2016 tavasza óta folyamatosan támad egy 32 dollárnál húzódó erős ellenállás szintet. Kicsit jobban megfigyelve a grafikont észrevehetjük, hogy júliustól ezidáig egy fordított fej-váll alakzatot rajzolt meg az árfolyammozgás, melynek jobb válla duplázódott.


Az RSI kitört a csökkenő trendjéből. Az árfolyam pedig két apró doji gyertyával a roppant erős ellenállás szint fölé ugrott, rést hagyva maga mögött. Véleményem szerint egy ilyen erős szintet mindenképpen vissza kell tesztelnie az árfolyamnak, illetve a hagyott rést is illene visszatöltenie.

Ha az árfolyam képes stabilan a meghatározó szint fölött maradni, úgy kalkulálhatunk a fordított fej és vállak alakzat számított célárának teljesülésével. A napos grafikon alapján a felveendő long pozícihoz rendelhető szintek a következők: nyitás 32 USD, célár 44 USD, veszteségvágó megbízás 27 USD. Az ebből számított hozam-kockázat arány: 2,4:1.


Amennyiben havi időtávon is megvizsgáljuk a grafikont, azt láthatjuk, hogy a napos perióduson kialakult alakzat céláránál (44 dollár) nem található meghatározó módon berajzolható szint. Azonban 52 dollárnál egy iszonyatosan erős szintet vélhetünk felfedezni, mely immáron 2002 óta meghatározó az árfolyam számára.
Amennyiben ezt a szintet tekintjük a tervezett long pozíciónk célárának, úgy az +60%-os hozammal kecsegtet, (természetesen a stop loss eredeti szinten tartása majd időközbeni feljebb húzása mellett).

Ezen idősíkon láthatjuk, hogy az árfolyam egy dupla alj gyertyaformációt rajzolt ki. Az RSI pedig ezen perióduson is kitört csökkenő trendjéből. Amennyiben az árfolyam képes leküzdeni az előtte tornyosuló tripla ellenállást (melyet a 100-as mozgóátlag, az enyhe csökkenő trendvonal és a dupla csúcs alakzat nyakvonala alkot), úgy irtózatos erővel lőhet ki felfelé, megcélozva az 52 dolláros szintet.

Egyetlen mondatban még érdemesnek tartom megemlíteni, hogy a Trump által hangsúlyozott gazdaságpolitika támogató lehet a felvázolt long pozíció célárainak megvalósulásában.


If you take a look to the chart of Alcoa (NYSE) on daily time frame you can realize there is a strong resistance line at 32 dollar. The price had trying to break out more times since spring, and the price-movement drew an inverse head and shoulders candlestick pattern with double right shoulders.

The RSI broke out from its downward trend. The price jumped up with two little dojies above the very strong resistance line, and leaving a gap behind itself. My opinion is that, the price need to test back the strong level, and fill back the gap as well.


If the price able to stay above the significant level, then you could wait that the price reach the target price of the inverse head and shoulders candlestick pattern. The important levels in connection with the planned long transaction are these: open 32 USD, target price 44 USD, stop loss 27 USD. So the risk-reward ratio is 1:2,4.

If you examine the chart on monthly time horizone, you will see, there is not significant price level at the target price (44 USD) of the inverse head and shoulders candlestick pattern. But you can recognize a very-very strong price level at 52 USD, which functions as a support-resistance level since 2002!!!
If this level is considered as the target price of the long transaction, you can hope a +60% yield (certainly on that way, you let the stop loss at the original level, and later pulling up to follow the rising price).


On this period, you can recognize a double bottom candlestick pattern on the chart. The RSI broke out from its downward trend - on this time frame as well. If the price able to break out from the triple resistance (which composed by the MA100, the slight downward trendline and the neckline of the double candlestick pattern), then it would go up as a rocket and would try to reach the level at 52 USD.

A single sentence even worthy to mention that, the emphasized economic policy of Donald Trump could support that, the price could reach the target price(s).

21 augusztus, 2016

Citigroup long

A Citigroup részvény (NYSE:C) árfolyama napos időtávon kitört egy több mint egy éve tartó csökkenő trendvonal szorításából. Ez pozitív jel, észre kell azonban vennünk, hogy az árfolyam előtt ott tornyosul még 2 erős ellenállás:
- vízszintes trendvonal 47,57-nél,
- szigetfordulós rés.


Az áttört trendvonal és a 100-as mozgóátlag azonban már támaszként szolgálhat, s ezek visszatesztelése után az árfolyam megküzdhet az említett ellenállásokkal.


Hetes bontásban szemlélve a grafikont, felfedezhetjük, hogy egy dupla alj gyertyaformációt rajzolt ki az árfolyammozgás. Az ebből számítható célár körülbelül 57 dollárra esik. Az árfolyam további emelkedését támaszthatja alá, hogy az RSI értéke is az 50-es szint fölé emelkedett.


A veszteségvágó megbízást a hátrahagyott rés alá célszerű elhelyezni, körülbelül 43 dollárra. A hozam-kockázat arány így kb. 2:1.

------------------------------------------------------------------------------------------------------------------------------------------------------

The price of the Citigroup share (NYSE:C) broke out from a downward trendline (which functioned as a resistance for more than a year) on daily period. This is a good sign, but you need to recognize that, there are two strong resistance in front of the price increase:
- a horizontal trendline at 47,57
- the gaps of the island reversal.

The broken trendline and the 100’ moving average could function as supports, so after the backtests of these, the price may be able to step over the mentioned resistances.

If you analyze the chart on weekly period, you can recognize that, the price-movement drew a double botton candlestick pattern. The target price of the pattern will be at about 57 dollar. The RSI increased above the value of 50 on weekly period, and this fact can support the further price increase.


I think, I need to place the stop loss order below the left gap, about at 43 dollar. The risk-reward ratio is about 1:2.

06 június, 2016

EUR-GBP short on the backtest

Pénteken elhelyezett függő short ajánlatom teljesült. Megpróbálom lekereskedni a kitörés visszatesztjét. Nyitás: 0,7900 Stop Loss: 0,8010 Célár: 0,7800


I placed a pending short order to the EUR-GBP currency pair, what is fulfilled today. I try to earn money on the backtest of the breakout. Open: 0,7900 Stop Loss: 0,8010 Target price: 0,7800

19 október, 2015

GBP-CAD H1 short and H4 long


A GBP-CAD árfolyama kitört a sávozásból H4 időtávon. Ilyen esetekben a sáv magasságával számolhatunk célárként. Azonban az RSI H1 és H4 perióduson is túlvettséget mutat.


Továbbá az árfolyam többszörös ellenálláshoz érkezett:
- csökkenő trendvonal napos perióduson
- az emelkedő sáv teteje H4 időtávon
- MA200 szintén H4-en
- valamint a legutolsó nagy eső gyertya szintje szintén H4-en.


Így azt gondolom, hogy most korrekció következik a kitörés szintjének visszatesztelésével (pont itt fut az MA100 is H4-en). Majd onnan ismét megindulhat az árfolyam felfelé, hogy elérje a kitörésből számítható célárat.


The exchange rate of the GBP-CAD currency pair broke out from the range on H4 time horizon. In similar cases, the target price use to be the height of the range. But the RSI is overbought on H1 and on H4 time frame as well.

Furthermore, the price arrived to a multiple resistance level, where are the:
- downward trendline on daily time horizon
- upper edge of the upward range on H4 period
- MA200 on H4 time frame
- the level of the last big bearish candlestick on H4 time frame.

I think that, now come a corrective phase, and the price will test back the level of the breakout (there is the MA100 on H4 as well). After the back test, the price can go up and reach the target price of the breakout.

16 október, 2015

EUR-JPY long


Az EUR-JPY grafikonján felismerhető egy dupla alj alakzat H1 időtávon. Az alakzatból való kitörés valószínűleg már meg is történt. Megpróbálok long pozíciót felvenni a visszatesztben. Az RSI emelkedő trendben mozog. Célár a következő vízszintes trendvonal. Stop az utolsó alj alá.


You can recognize a double bottom candlestick pattern on the chart of the EUR-JPY on H1 time frame. I think that, the breakout already happened. I try to open long transaction from the backtest of the breakout level. The RSI moves in upward trend. Target price is the next horizontal trendline. I placed the stop loss below the previous bottom.

27 augusztus, 2015

AUD-CAD long


Az AUD-CAD árfolyam egy sávban mozog napos időtávon. Jelenleg kb. a sáv alján tartózkodik az árfolyam.


Óráson egy csökkenő trendcsatornából készül kitörni. Az RSI emelkedő trendben mozog.

Az első ellenállás a 100-as mozgóátlag lehet.


The price of the AUD-CAD moves in trend channel on daily period. Nowadays we are in the bottom of this.

There is a downward trend channel on H1 time frame, and the price is begin to breaking out from it now. The RSI moves in upward trend. The first resistance could be the 100’ moving average.

09 június, 2015

AUD-USD jelre várva - AUD-USD waiting for an entry signal


Az AUD-USD árfolyam elkezdett építeni egy fordított fej és vállak alakzatot H1 időtávon. Az alakzat kiépülésének ellentmond ugyan az RSI csökkenő trendje, azonban érdemes lehet figyelni a grafikont.

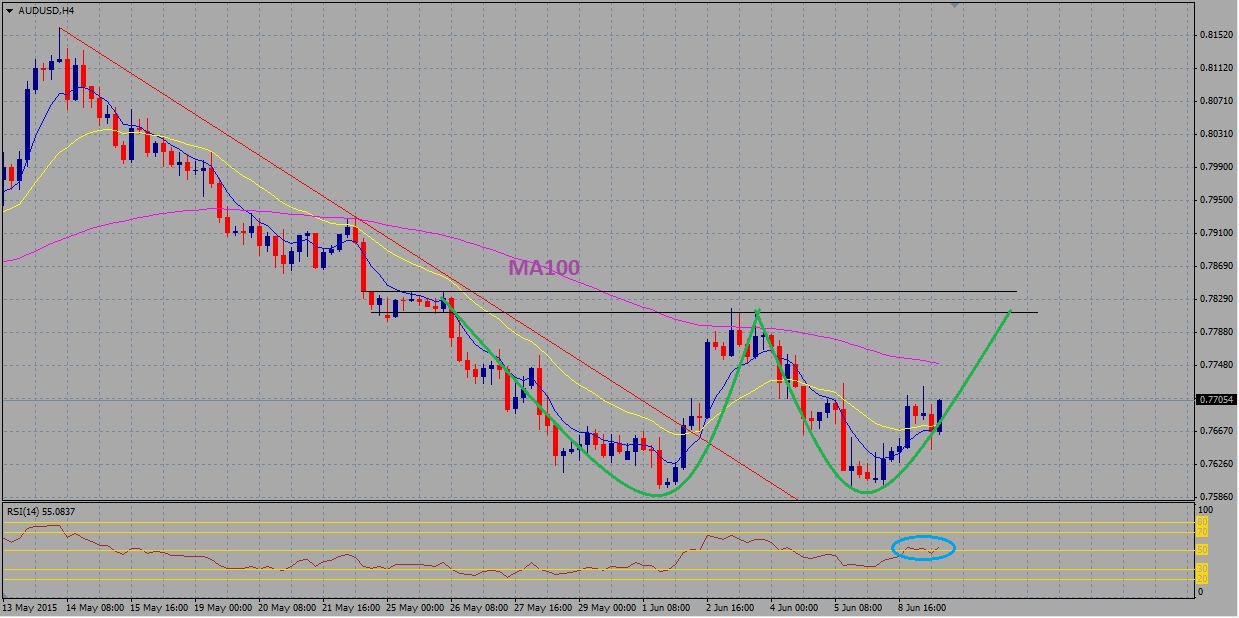
H4 időtávon az RSI felfelé tart. Itt az első erős ellenállásnak a 100-as mozgóátlag tűnik, majd ha képes annak fölé emelkedni az árfolyam, akkor egy lehetséges duplaalj nyakvonala jelenthet majd gátat a további emelkedésnek.

Azonban mindenképpen figyelemre méltó, hogy az árfolyam kitört a május 14. óta tartó csökkenő trendvonal alól és nem esett a korábbi alj szintje alá. Szóval jelenleg még minden csak feltételezés, de érdemes lehet figyelni a longra utaló beszálló jelzéseket!

------------------------------------------------------------------------------------------------------------------------------------------------------
The price of the AUD-USD start to build an inverse head and shoulders candlestick pattern on H1 time frame. Against the mentioned pattern, the RSI moves in downward trend.

The RSI moves in upward trend on H4 time frame. The first strong resistance is the 100’ moving average on this period. If the price able to rise above the MA100, the next strong level will be the neckline of a potential doube bottom.

In addition, there is an important momentum: the price broke out from a downward trendline what functioned as a resistance since 14th of May; and in the end of the last downward phase, the price able to rebound from the level of the last bottom.
So now, everything is just a hypothesis, but that could be valuable if you pay attention to the long entry signals.