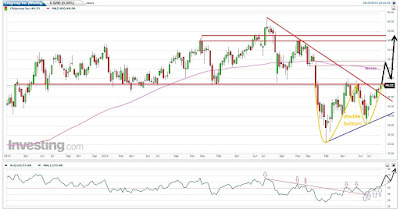
A Citigroup részvény (NYSE:C) árfolyama napos
időtávon kitört egy több mint egy éve tartó csökkenő trendvonal szorításából.
Ez pozitív jel, észre kell azonban vennünk, hogy az árfolyam előtt ott
tornyosul még 2 erős ellenállás:
- vízszintes trendvonal 47,57-nél,
- szigetfordulós rés.
Az áttört trendvonal és a 100-as mozgóátlag azonban
már támaszként szolgálhat, s ezek visszatesztelése után az árfolyam megküzdhet az
említett ellenállásokkal.
Hetes bontásban szemlélve a grafikont,
felfedezhetjük, hogy egy dupla alj gyertyaformációt rajzolt ki az
árfolyammozgás. Az ebből számítható célár körülbelül 57 dollárra esik. Az
árfolyam további emelkedését támaszthatja alá, hogy az RSI értéke is az 50-es
szint fölé emelkedett.
A veszteségvágó megbízást a hátrahagyott rés alá
célszerű elhelyezni, körülbelül 43 dollárra. A hozam-kockázat arány így kb.
2:1.
------------------------------------------------------------------------------------------------------------------------------------------------------
The price of the Citigroup share (NYSE:C) broke out
from a downward trendline (which functioned as a resistance for more than a
year) on daily period. This is a good sign, but you need to recognize that,
there are two strong resistance in front of the price increase:
- a horizontal trendline at 47,57
- the gaps of the island reversal.
The broken trendline and the 100’ moving average
could function as supports, so after the backtests of these, the price may be able
to step over the mentioned resistances.
If you analyze the chart on weekly period, you can
recognize that, the price-movement drew a double botton candlestick pattern.
The target price of the pattern will be at about 57 dollar. The RSI increased
above the value of 50 on weekly period, and this fact can support the further price
increase.
I think, I need to place the stop loss order below
the left gap, about at 43 dollar. The risk-reward ratio is about 1:2.


Nincsenek megjegyzések:
Megjegyzés küldése