A következő címkéjű bejegyzések mutatása: cup and handle candlestick pattern. Összes bejegyzés megjelenítése

17 május, 2018

Az elfeledett GoPro – The forgotten GoPro


GoPro long lehetőség


A GoPro (NYSE: GPRO) napi grafikonjára tekintve láthatjuk, hogy az árfolyam előbb leküzdött egy csökkenő trendvonalat, majd kialakított egy dupla alj gyertyaformációt. Jelenleg a 100-as exponenciális mozgóátlag jelent erős ellenállást az árfolyam további emelkedése számára. Amennyiben az árfolyam képes lenne leküzdeni azt, úgy egész a következő ellenállásig, a nagy eső gyertya tetejénél húzódó horizontális trendvonalig szaladhatna.


Amennyiben 4 órás időtávon szemléljük a chartot, feltűnhet, hogy a dupla alj második tagja immáron egy füles csésze gyertyaalakzattá fejlődött. Vagyis, alakzat az alakzatban mintáról van szó, mely tapasztalataim szerint egy erősebb indikáció.
Itt már az is látszik, hogy a következő ellenállás a rés, mely visszatölthető lehet.
Stopként pedig ezen időtáv eMA100-a szolgálhat, mely értéke jelenleg megegyezik az utolsó nagy emelkedő gyertya aljával.


Elképzelés:
irány: long
beszálló: eMA100 felett (naposon) ~ 6,00 USD
célár: a rés ~ 7,50 USD
stop: eMA100 felett (H4-en) ~ 5,20 USD
hozam-kockázat arány: ~ 2:1


GoPro long chance


The price-movement of the GoPro share (NYSE: GPRO) broke out from the decreased trendline, and later, it formed a double bottom candlestick pattern on daily period. If the price able to rise above the first (and strong) resistance what is the eMA100, this might reach the top of the last big bearish candlestick.


If You check the chart on H4 timeframe, you can realize that, the second bottom modified into a ’cup with handle’ candlestick pattern. So this is a pattern in the pattern formation, and based on my experience it is a strong indication.
On this shorter timeframe, you can recognize that, the next resistance is the gap, and the price might fill back it.
You can use the eMA100 on H4 as a stop loss (the current value of it is equal with the bottom of the last big bullish candlestick).


My theory:
direction: long
entry point: above the eMA100 (on daily period) ~ 6,00 USD
target price: the gap ~ 7,50 USD
stop loss: under the eMA100 (on H4 timeframe) ~ 5,20 USD
risk-reward ratio: ~ 1:2

15 szeptember, 2016

GBP-CAD long

A GBP-CAD árfolyama egy dupla alj alakzatot formált, ahol a második alj egy füles csésze alakzattá bővült (az egész formációt esetleg tekinthetjük egy fordított fej-váll alakzatnak is).
Ellenállások:
- rés + MA100
- vízszintes trendvonal + MA200


H4 időtávon megjelent bullish gyertyaformációk:
- fordított fej-váll alakzat
- füles csésze alakzat.


Fundamentális oldalról segítség lehet, amennyiben:
- csendesednek a BREXIT miatti aggodalmak,
- az olaj árfolyama jelentős esést produkál (lásd előző bejegyzésem a WTI kapcsán).


The price-movement of the GBP-CAD currency pair formed a double bottom candlestick pattern, where the second bottom modified to a cup with handle candlestick pattern (whether, you can call the whole pattern to inverse head and shoulders candlestick pattern).
Resistances:
- gap + MA100
- horizontal trendline + MA200

There appeared two bullish candlestick patterns on H4 time frame:
- an inverse head and shoulders candlestick pattern and
- a cup with handle candlestick pattern.

On the fundamental side, the price increase could support by:
- if the BREXIT-fear will decrease,

- if the oil price start a significant decrease (check my previous post in connection with WTI).

07 május, 2015

EUR-CAD long


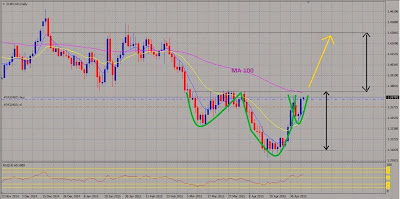
Egy fordított fej-váll alakzat alakult ki az EUR-CAD grafikonján napos időtávon. Amennyiben az árfolyam képes átlépni az alakzat nyakvonalát és a 100-as mozgóátlagot komoly emelkedésre számíthatunk. Órás bontásban egy fülescsésze gyertyaalakzatot ismerhetünk fel a grafikonon. Árnyalja a képet, hogy az RSI H1 és H4 időtávon is túlvett.


Tapasztalataim szerint, ha két különböző idősíkon is egyirányba mutató gyertyaformációt fedezünk fel, gyakran elég egy kis szikra az árfolyamrobbanáshoz, ilyen lehet pl. a mai Nagy-Britanniában tartandó parlamenti választás.


There is an inverse head and shoulders candlestick pattern on the chart of the EUR-CAD on daily period. If the price able to rise above the neckline of the pattern and the 100’ moving average, there would be a huge rise. In addition you can recognize a cup with handle candlestick pattern on the chart on H1 time frame. But I need to mention that, the RSI is overbought on H1 and H4 time frame.

As I experienced that, if you recognize two candlestick patterns on two different time horizon, and those forecast strong price-movement to the same direction, enough a little catalyst to the big boom; such as for example the today's parliamentary elections in Great Britain.

19 november, 2014

Fülescsésze alakzat az EUR/USD grafikonján – ’Cup and handle’ candlestick pattern on the chart of the EUR/USD


A célár kb. 1,2630. Stop elhelyezése: 1,2510 - spread. Gyertyánként húzzuk feljebb a stoppot.


Target price is about 1,2630. Take the stop: 1,2510 - spread. Pull up the Stop Loss candle by candle.