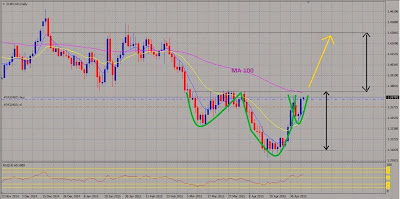
Egy fordított fej-váll alakzat alakult ki az EUR-CAD
grafikonján napos időtávon. Amennyiben az árfolyam képes átlépni az alakzat
nyakvonalát és a 100-as mozgóátlagot komoly emelkedésre számíthatunk. Órás bontásban egy fülescsésze gyertyaalakzatot ismerhetünk
fel a grafikonon. Árnyalja a képet, hogy az RSI H1 és H4 időtávon is túlvett.
Tapasztalataim szerint, ha két különböző idősíkon is egyirányba mutató
gyertyaformációt fedezünk fel, gyakran elég egy kis szikra az
árfolyamrobbanáshoz, ilyen lehet pl. a mai Nagy-Britanniában tartandó
parlamenti választás.
There is an inverse head and shoulders candlestick pattern
on the chart of the EUR-CAD on daily period. If the price able to rise above
the neckline of the pattern and the 100’ moving average, there would be a huge
rise. In addition you can recognize a cup with handle candlestick
pattern on the chart on H1 time frame. But I need to mention that, the RSI is
overbought on H1 and H4 time frame.
As I experienced that, if you recognize two candlestick
patterns on two different time horizon, and those forecast strong price-movement
to the same direction, enough a little catalyst to the big boom; such as for
example the today's parliamentary elections in Great Britain.


Nincsenek megjegyzések:
Megjegyzés küldése