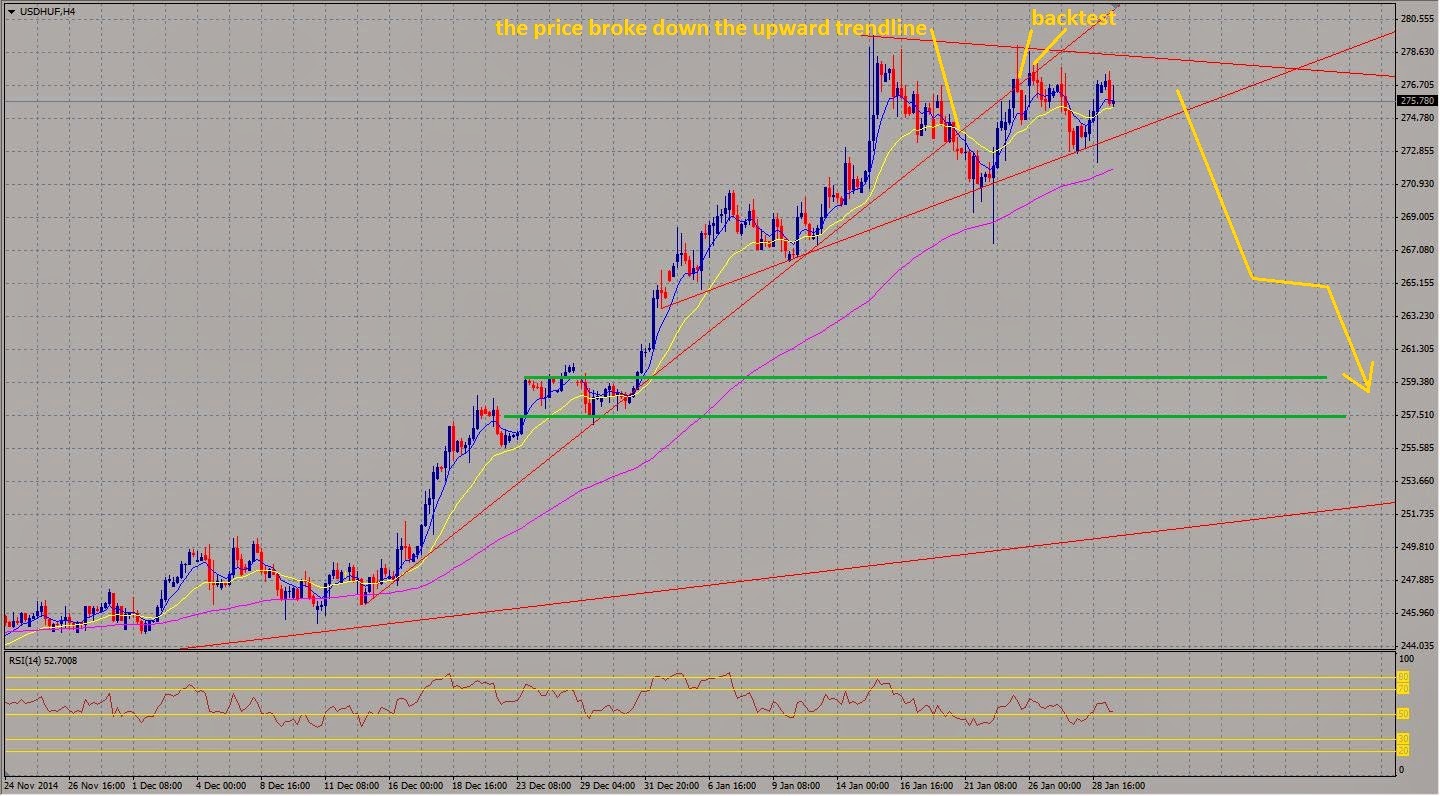
Az USD-HUF grafikonja tört egy december 15 óta tartó
emelkedő trendet 4 órás időtávon január 21-én, majd 23-án és 26-án
visszatesztelte a letört trendvonalat. Jelenleg egy rövidtávú ellenállás és egy
rövid távú támasz között mozog az árfolyam.
Amennyiben az ár töri a támaszt, gyorsan a 260 forintos
szintig eshet. Az RSI csökkenő trendben mozog 4 órás és napos időtávon. A 100-as mozgóátlag támaszként szolgálhat órás és négy órás időtávon egyaránt.
The exchange rate of the USD-HUF broke down an upward
trendline on H4 time frame, which functions as a support since 15th of December.
After it, the price tested back the broken trendline at 23rd and 26th of
January. Currently the price is moving between a shorter term resistance and a
shorter term support.
If the price able to breaks down the support then could fall
down quickly to about the level of 260 HUF. The RSI moves in downward trend on
H4 time frame and daily period. The 100' moving average can functions as a support on H1 time frame and H4 time frame as well.


Nincsenek megjegyzések:
Megjegyzés küldése