11 március, 2015

GBP-CHF short


A GBP-CHF devizapár árfolyama visszatöltötte a Svájci Nemzeti Bank elhíresült döntése során keletkezett hatalmas rést. Az árfolyam teszteli a január 26. óta támaszként szolgáló emelkedő trendvonalat. Valamint az angol font - svájci frank devizapár grafikonján H4 időtávon felfedezhetünk egy trendfordító gyertyaformációt. Továbbá az RSI felülről metszette a 70-es szintet.
A felsorolt tényezők együttese jó alapot nyújt, hogy megkíséreljünk short pozíció(ka)t nyitni.


The exchange rate of the GBP-CHF filled back the huge gap what generated by the famous decision of the Swiss National Bank. The price tests the upward trendline, what functions as support since 26th of January. In addition you can recognize a reversal candlestick pattern on the chart of the great britain pound - swiss franc currency pair on H4 time frame. Furthermore the RSI moves in downward trend and crossed the value of 70.
So the based on the above mentioned factors, you can try to open short transaction(s).

02 március, 2015

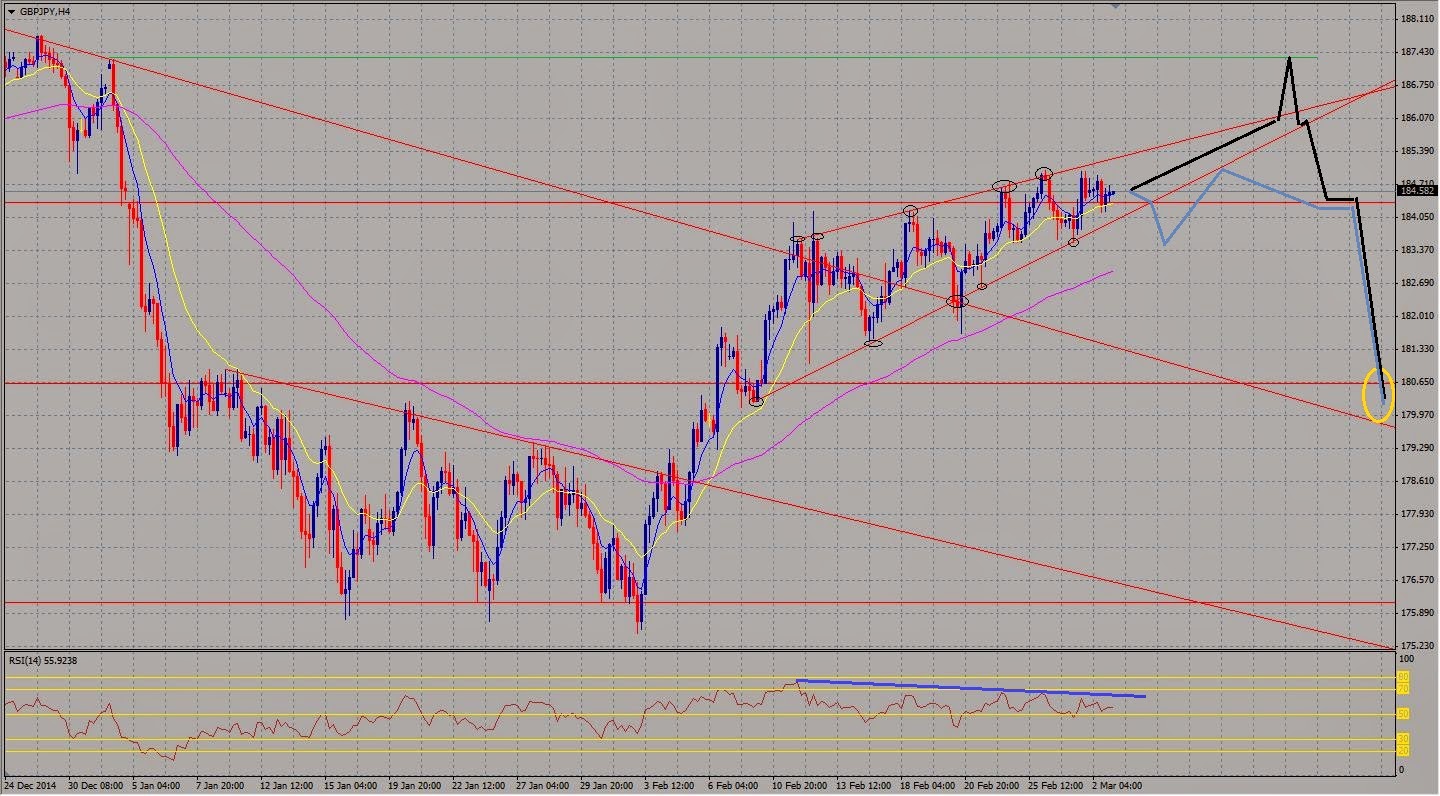
GBP-JPY, emelkedő ék – rising wedge


Az angol font - japán jen devizapár árfolyama egy emelkedő ékben mozog, immár február 10-e óta. Figyelnünk kell, hogy az árfolyam mikor töri le az alakzat támaszként szolgáló alsó trendvonalát; ugyanis az emelkedő ék erőteljes esést szokott előjelezni.

Meglátásomat támogatja, hogy 4 órás időtávon erős divergenciát fedezhetünk fel az árfolyam és az RSI mozgása között. Az árfolyam egyre magasabb csúcsokat alakít ki az ékben felfelé haladva, míg az RSI maximum azonos magasságú csúcsok megformálására képes.


The exchange rate of the great britain pound - japanese yen currency pair moves in a rising wedge since 10th of February. The pattern composed by two converging upward trendlines. You need to take attention that, when the price will break down the pattern – as the rising wedge is a short signal.

My opinion supported by that, there is a strong divergence between the movement of the price and the movement of the RSI, on H4 time frame. The price forms higher and higher tops (while moves ahead in the rising wedge), but the RSI (relative strength index) only could reach the same heights.

20 február, 2015

USD-JPY short


Az USD-JPY árfolyama egy fej-váll gyertyaalakzatot formál H4 időtávon. (Ráadásul a jobb váll egy duplacsúcs.) Támasz az MA100 és az alakzat nyakvonala. Ezek törése esetén jó eséllyel nyithatunk short pozíciót.


The price movement of the USD-JPY forms a ’head and shoulders’ candlestick pattern on H4 time frame. (In addition, the right shoulder involves a ’double top’ candlestick pattern.) Supports: the MA100 and the neckline of the pattern. If the price breaks down these, we’ve got a good chance to open short transaction.

GBP-JPY short


A GBP-JPY árfolyam letörte egy mini fej-váll alakzat nyakvonalát órás időtávon. Amennyiben az árfolyam visszateszteli a trendvonalat vagy az MA100-at, jó eséllyel nyithatunk short pozíciót. A csökkenő trendvonal támaszként szolgálhat egy ideig.


The price of the GBP-JPY broke down the neckline of a mini ’head and shoulders’ candlestick pattern on hourly time frame. If the price tests back the broken trendline or the MA100, we have a good chance to open short transaction. The downward trendline can functions as a support.

GBP-USD short


A GBP-USD árfolyam tört egy emelkedő trendvonalat H4 időtávon. Amennyiben az árfolyam visszateszteli az ellenállásszinteket, jó eséllyel nyithatunk short pozíciót. A 100-as és 200-as mozgóátlag támaszként szolgálhat. Kockázatot hordoz azonban, hogy a napos trend továbbra is emelkedő.
 

The exchange rate of the GBP-USD broke down an upward trendline on H4 time frame. If the price tests back the resistance levels, we will have a good chance to open short transaction. The MA100 and the MA200 can function as supports. The risk is that, the daily trend is upward yet.

szimmetrikus háromszög az EUR-USD grafikonján, EUR-USD symmetrical triangle


Mivel nagyon csúnyán belekevergőztem egy betegségbe, így csak szűkszavúan.
Az EUR-USD árfolyama egy szimmetrikus háromszögben mozog H4 bontásban. A hely egyre szűkül, oda kell figyelni. Szimmetrikus háromszögeknél nem tudjuk merre pattan el az árfolyam, de általában a trendirány valószínűbb. Ez jelenleg lefelé mutatna. A háromszög felső szárának visszatesztelése esetén jó eséllyel nyithatunk short pozíciókat. Célár a háromszög magassága.


I am very ill, so just few sentences.
The exchange rate of the EUR-USD moves in a symmetrical triangle on H4 time frame. The space is less and less in the triangle, so we need to take more attention to this candlestick pattern. The technical analysis can not say which is the right direction in the case of the symmetrical triangle. But in such cases, the direction of the main trend has got more chance. And it is down. If the price would test back the upper leg of the triangle, we would have a good chance to open short transactions. Target price is the height of the triangle.